How to Monitor Windows System Utilization for xPortalNet Server or Client PC

Problem (Issue) Statement:

How to monitor Windows system utilization for xPortalNet Server or Client PC

Description:

Monitoring performance data and comparing it to established baselines are crucial to determining the health of computers, as is examining events in the event logs. Many events are informational, but you should not ignore them because of that. User must determine what to be addressed and what can be safely ignore, never ignore warnings and error events that indicate real and immediate problems.

Windows operating system come with plenty of built-in tools to analyse resource usage and monitor system performance for real time system activities, terminating misbehaving processes, and performing some rudimentary performance analysis. It runs at a higher priority than normal applications, and it has sufficient privilege to view and control the system's running processes.

Related Software:

NIL

Related Hardware:

  • Desktop computer

System Application:

NIL

Symptom and Finding:

NIL

Cause:

For first time guide to monitor Windows system utilization for xPortalNet Server or Client PC.

Solution:


Summary:

  • Check windows.

  • Check resource monitor.

.

Step-by-step Guide:

  • Check windows system load:

Step 1: The Task Manager is a tool that runs on the surface. It lists processes, services and general resource usage.

.

Step 2: Below are a few ways to open Task Manager:

  1. Right-click the Taskbar and click on Task Manager.
  2. Open Start, do a search for Task Manager and click the result.
  3. Use the Ctrl + Alt + Del keyboard shortcut and click on Task Manager.
  4. Use the Ctrl + Shift + Esc keyboard shortcut.
  5. Use the Window key + X keyboard shortcut to open the power-user menu and click on Task Manager.

.

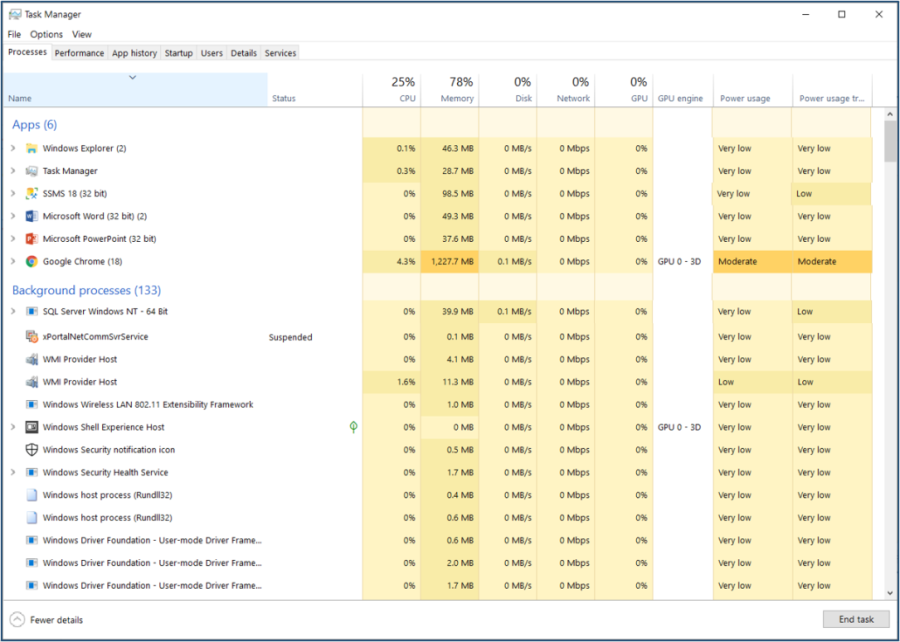
Step 3: The Task Manager window will be shown as below and provides quick access to Processes, Performance, Users, Detail and Services tab. We'll go through each tab to see what they have to offer and discover what to look for when checking system load.
Task Manager Window 
Figure 1: Task Manager Window

.

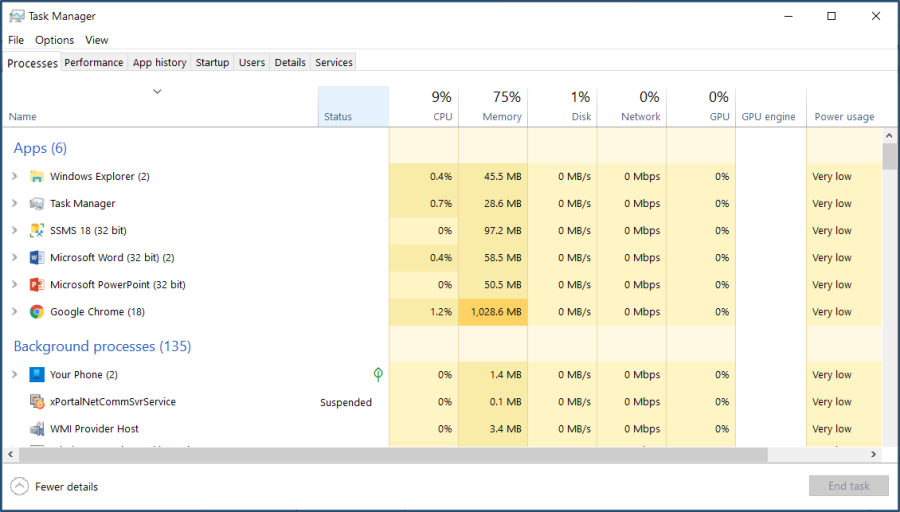
Step 4: The Processes tab shows everything that is running in the system and the amount of CPU and memory resources it is using for each individual app and process.
Processes Tab 
Figure 2: Processes Tab

.

Troubleshooting Tip

By clicking the CPU or Memory column headings, users can sort the process list from highest to lowest usage and vice versa.

Always keep record of the application that is using high amounts of CPU and memory. It may potentially be a source of performance issue. 

.

.

Step 5: The Performance tab has the most visually appealing display of information and allows user to select CPU, Memory, and Ethernet views to show activity over a 60 second period. With this view, the user is able to identify spikes or see the trend over time to determine if a condition is temporary or sustained. The following sections will highlight some of the charts under the Performance tab.

.

  1. CPU Performance:
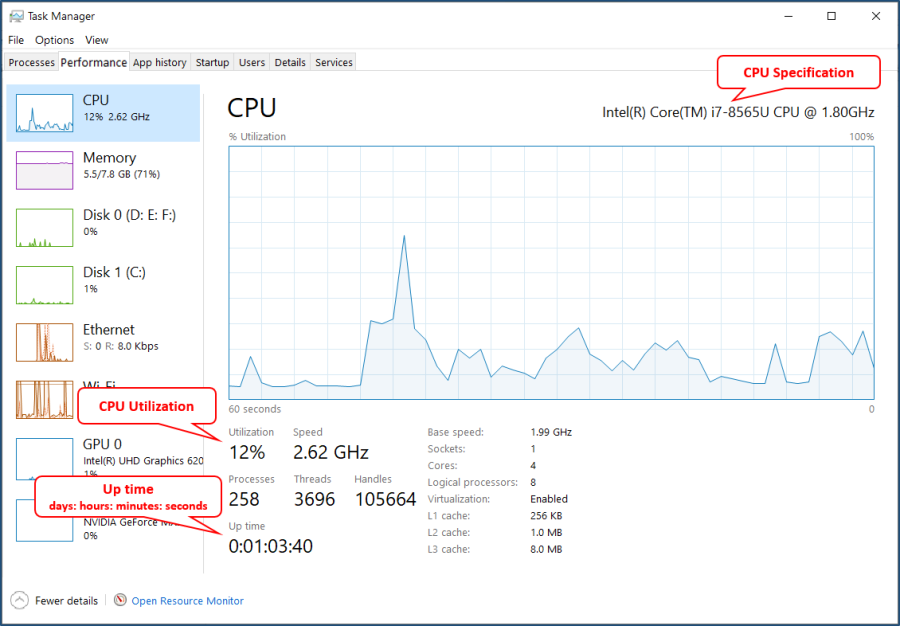
    CPU performance information shows us the type of CPU and speed, the number of processes, threads, and handles in use. We can also see how long the system has been up (uptime). This last bit of information can tell us how long the server has been running, confirm if it successfully completed a restart, or if it rebooted unexpectedly due to running out of resources.
    CPU Chart in Performance Tab 
    Figure 3: CPU Chart in Performance Tab
    .
    .

    If the CPU Utilization level is 90% or higher and is sustained over a long period of time, computer performance will be sluggish, and it could affect the stability of the system.

    User need to look at other systems to determine whether it is due to applications or insufficient physical memory. Doing this will cause the CPU and disk resources to spike and remain high. 

    .
    .

    .

  2. Memory Performance:
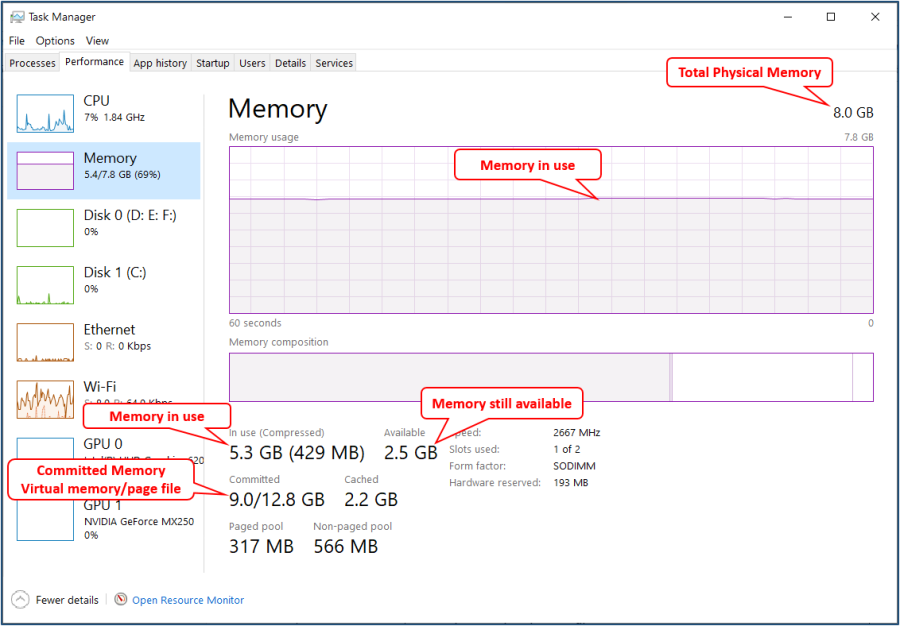
    Memory Performance information shows us the total amount of memory in the system that is in use and available. Committed represents the virtual memory and the page file (an extension of RAM) on disk. Cached represents memory used by Windows, and the Paged pool represents memory used by Windows that can be paged out to the page file on disk if memory starts running low.
    Memory Chart in Performance Tab 
    Figure 4: Memory Chart in Performance Tab
    .
    .

    When looking at the Committed Memory, we can see that virtual memory is 9.0 GB while the page file is 12.8 GB. In this example, we have not maxed out the page file. If we find the system is continuously running with the CPU and Memory at or above 90%, it is a strong indicator to add physical memory to the system to reduce the use of virtual memory. 

    .
    .
    .

  3. Ethernet Performance:
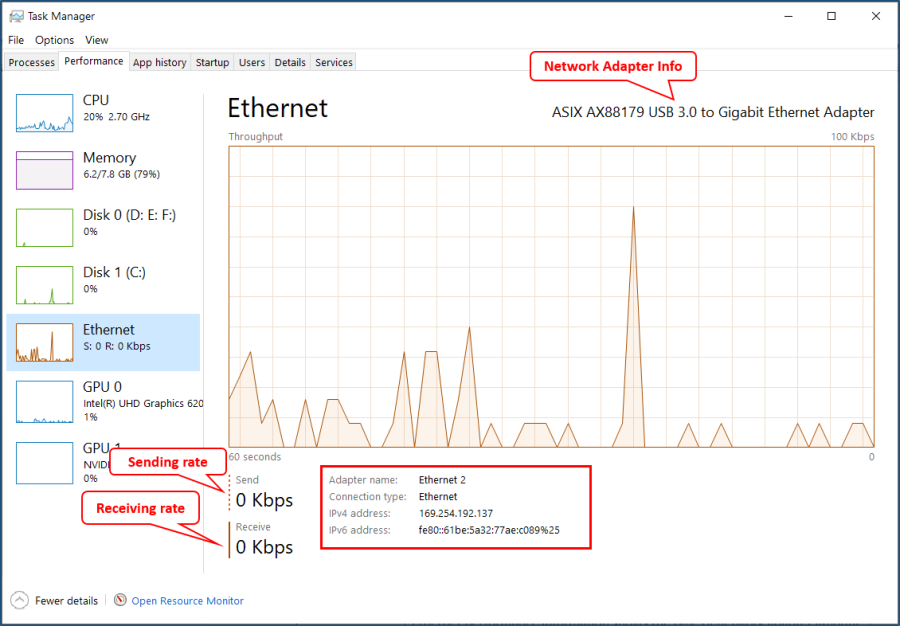
    Ethernet performance information shows the type of network adapter resources it is using with a graphed line for both outbound and inbound traffic, and numeric values for the data being sent. We can also see the Adapter name, Connection type, and the IP address(es) assigned. Right-clicking on the graph will allow us to see network details including network utilization, link speed, state, bytes send and received, etc. On the Performance tab, we also have the option to launch Resource Monitor to see even more details.
    Ethernet Chart in Performance Tab
    Figure 5: Ethernet Chart in Performance Tab

.

.

  • Check Resource Monitor:

Step 1: The Resource Monitor tool gives user the option to look under the surface for more information that the Task Manager does not provide.

.

Step 2: Press Windows + R to open the run box. Type resmon.exe, and press Enter.

.

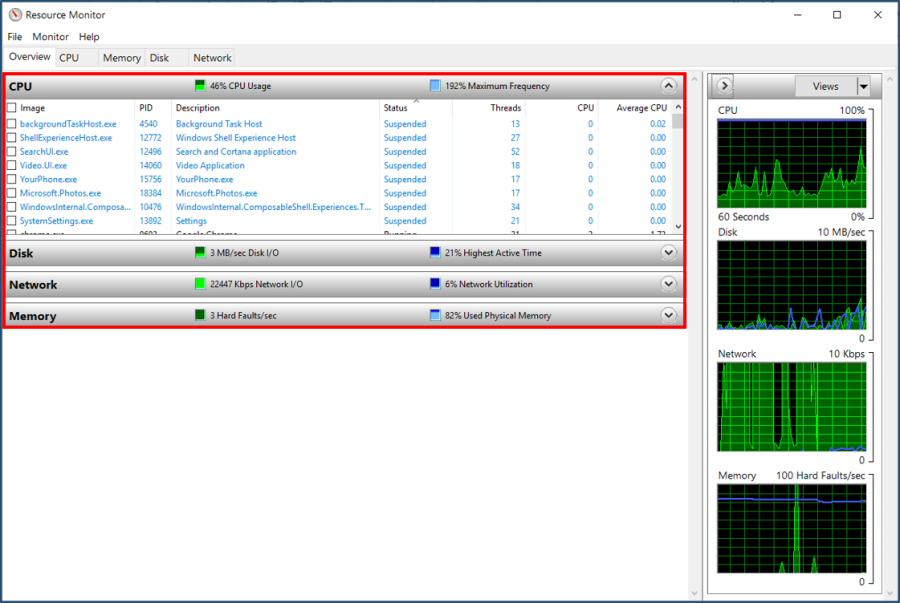
Step 3: The Resource Monitor interface will be shown as below. Overview tab highlights the CPU, Disk, Network and Memory usages in real-time.
Overview Tab in Resource Monitor Window
Figure 6: Overview Tab in Resource Monitor Window

.

  1. CPU - handle processes, services, associated handles and modules to show individual CPUs and load in addition to total CPU.
  2. Disk - handle processes and breakdown each task reading and writing to disk. The graphs show total disk activity to Queue Length. Disk Queue length indicates I/O operations that are queued up waiting for turn to be processed by disk. This number will be higher in systems that lack sufficient physical memory.
  3. Network - handle processes with network activity, in addition to TCP connections and listening ports, and graphs to show network transfer and TCP connections. Sustained high network utilization can indicate congestion issues and a need for more capacity.
  4. Memory - handle processes and breakdown of the physical memory and graphs to show commit charge which relates to use of the page file and the number of hard faults per second. If your system is showing hundreds of hard faults per second, this indicates a need for more physical memory.

.

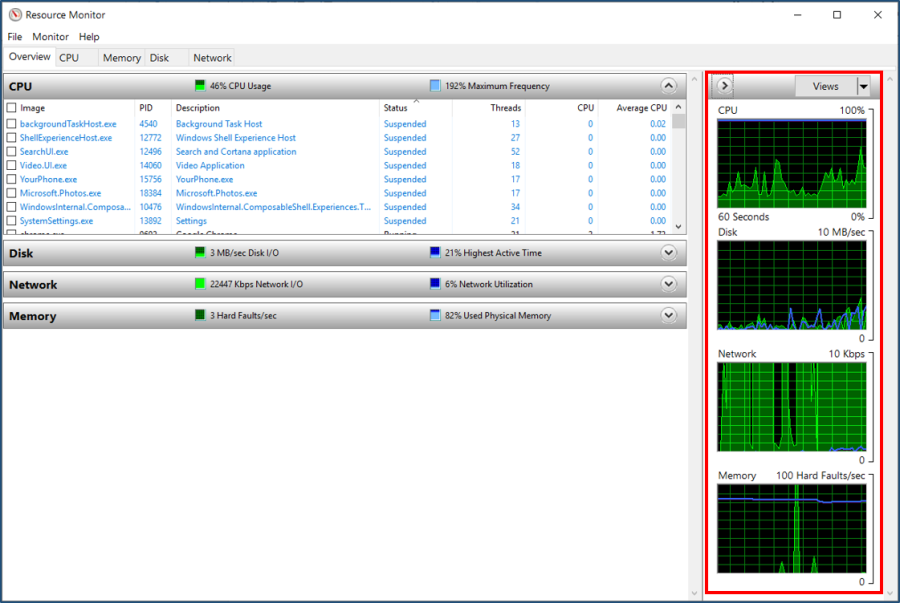
Step 4: The sidebar display graphs highlight the CPU, Disk, Network and Memory use over a period of 60 seconds.
Sidebar Graphs Showing Usage Data over 60 Seconds Period 
Figure 7: Sidebar Graphs Showing Usage Data over 60 Seconds Period

.

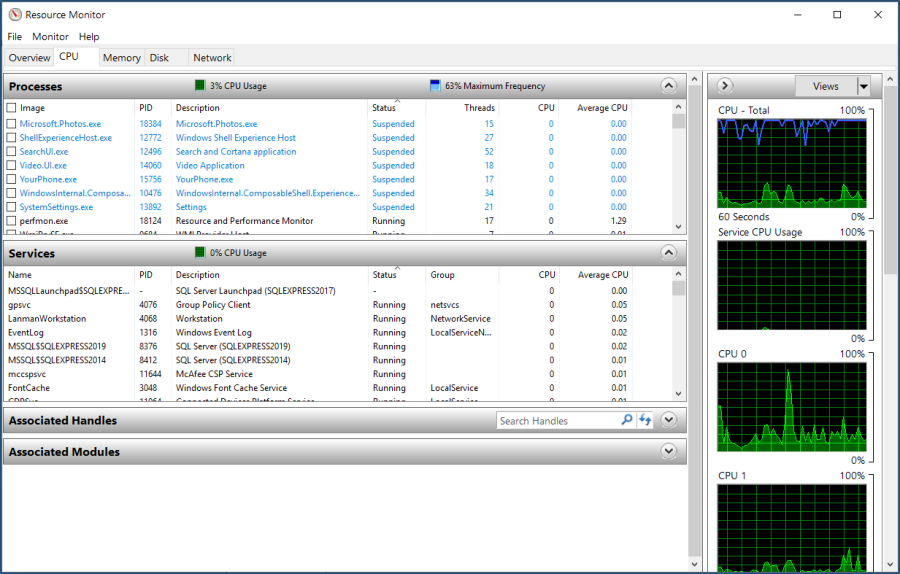
Step 5: Switch to CPU tab to monitor CPU utilization in detail. User is able find the Processes listing of the overview tab and 3 other listings which include the Services, Associated Handles and Associated Modules listings. User can filter by processes to display data only for those processes.
CPU Tab in Resource Monitor Window 
Figure 8: CPU Tab in Resource Monitor Window

  1. Processes may be displayed using colors. A red process indicates that it is not responding, and a blue one that it is suspended.
  2. Services context menu is limited to starting, stopping and restarting services and to search online for information.

.

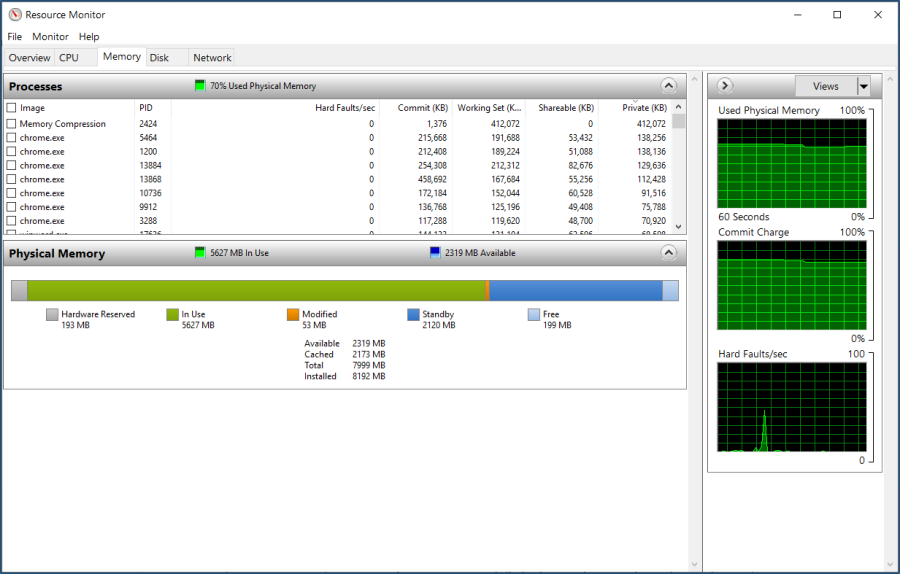
Step 6: The memory tab focus on memory usage. It features a physical memory view on top allowing user to visualize the distribution of memory on the Windows machine.
Memory Tab in Resource Monitor Window 
Figure 9: Memory Tab in Resource Monitor Window

.

The graphs highlight the used physical memory, the commit charge, and the hard faults per second.

Each process is listed with its name and process ID, the hard faults, and various memory related information.

  1. Commit – Amount of virtual memory reserved by the operating system for the process.
  2. Working Set – Amount of physical memory currently in use by the process.
  3. Shareable – Amount of physical memory in use by the process that can be shared with other processes.
  4. Private – Amount of physical memory in use by the process that cannot be used by other processes.

.

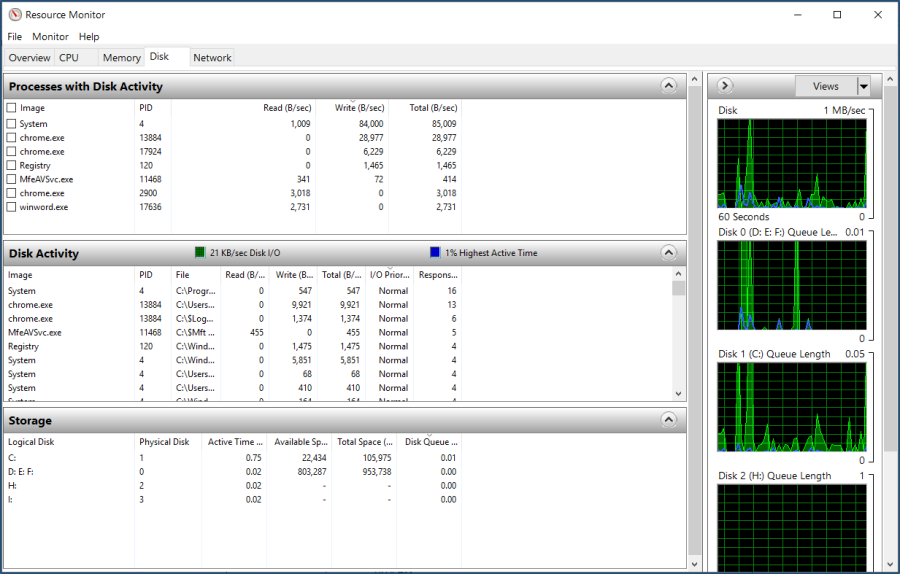
Step 7: The Disk tab shows disk activity of processes and storage information.
Disk Tab in Resource Monitor Window 
Figure 10: Disk Tab in Resource Monitor Window


It visualizes the disk usage in total and for each running process. You get a reading of each processes' disk read and write activity, and can use the filtering options to filter by a particular process or several processes.

The Storage listing at the bottom lists all available drives, the available and total space on the drive, as well as the active time.

.

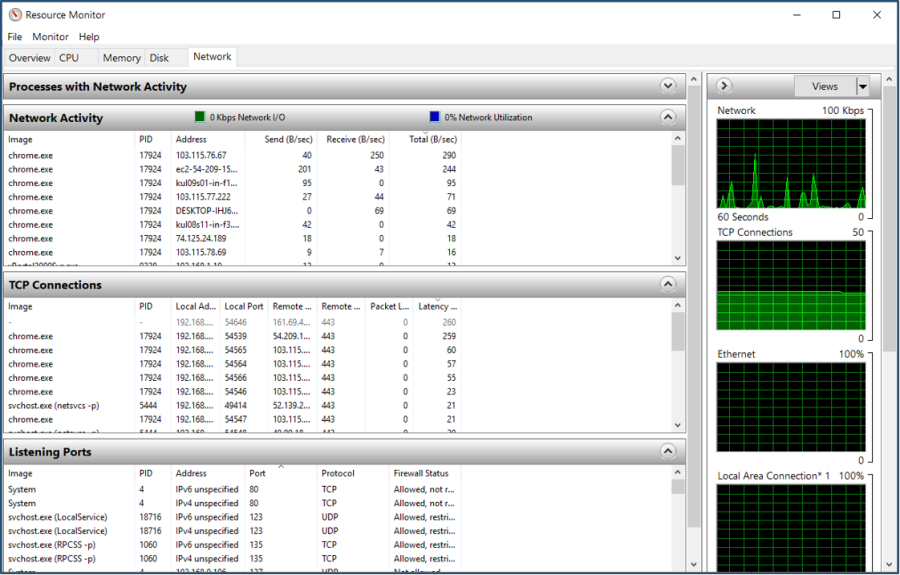
Step 8: The Network tab lists network activity, TCP connections and listing ports.
Network Tab in Resource Monitor Window 
Figure 11: Network Tab in Resource Monitor Window

.

Things User can Use Resource Monitor For

  • Check Hard Faults, and used Physical Memory to find out if your PC needs more RAM. Hard Faults happen when data that a process needs is pulled from disk (Page File) and not from memory. Physical Memory is straightforward, as it highlights how much of the available RAM is in use.
  • Use the CPU tab to associate processes with Windows Services.
  • Find out which program write to disk at a specific point in time.
  • List all outbound connections of the PC, or find out if a process connects to the Internet.
  • Check all listening ports, and close those that you don't require.

Common Issue

NIL

Date Documentation:

13/5/2020 (Rev 1.0)

PROOF-READ

.

Related Articles.

Containing the label "system-maintenance"

Filter by label

There are no items with the selected labels at this time.

.


.

© MicroEngine Technology Sdn Bhd (535550-U). All rights reserved.